Kaggle’s Titanic Challenge on Dataiku!
Introduction
 Titanic was under the command of Capt. Edward Smith, who also went down with the ship. The ocean liner carried some of the wealthiest people in the world, as well as hundreds of emigrants from Great Britain and Ireland, Scandinavia and elsewhere throughout Europe, who were seeking a new life in the United States. The first-class accommodation was designed to be the pinnacle of comfort and luxury, with a gymnasium, swimming pool, libraries, high-class restaurants and opulent cabins.
Installation
On this repository, you may find my personal projects related to Machine Learning, EDA, Python Jupyter Notebook and couple of Visualization based on the Dataiku Platform exported standard files. Most of the datasets I’ve been working with, downloaded from Kaggle. Installation pretty straight forward. Simply download the whole set as a single project as a ZIP files, everything have been flattened out with plain text files, and no SQL dump was involved, so there wouldn’t be any missing system dependencies issue.
Data Flow
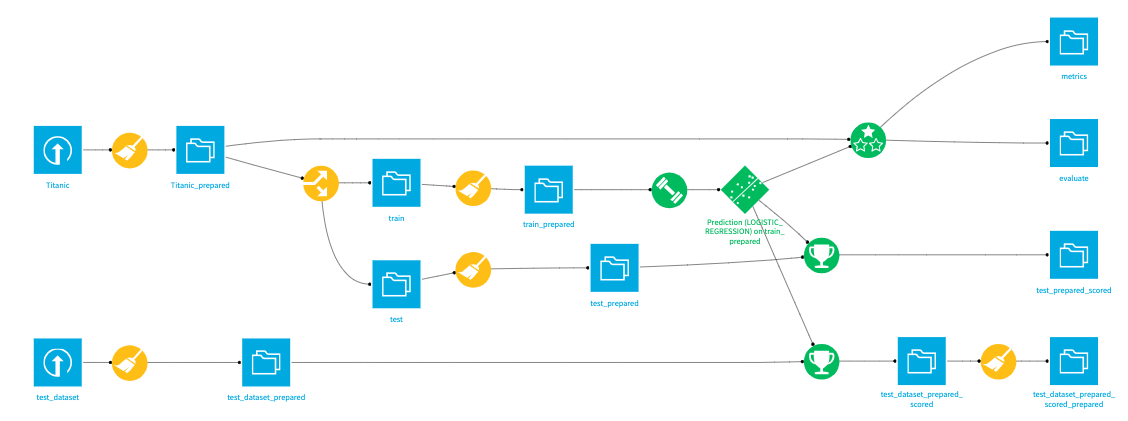 This is how I created the data flow visualization process, and by the end of it, I’m applying, both the Logistic Regression and the Decision Tree Model to supply the Machine Learning challenge.
Features Handling
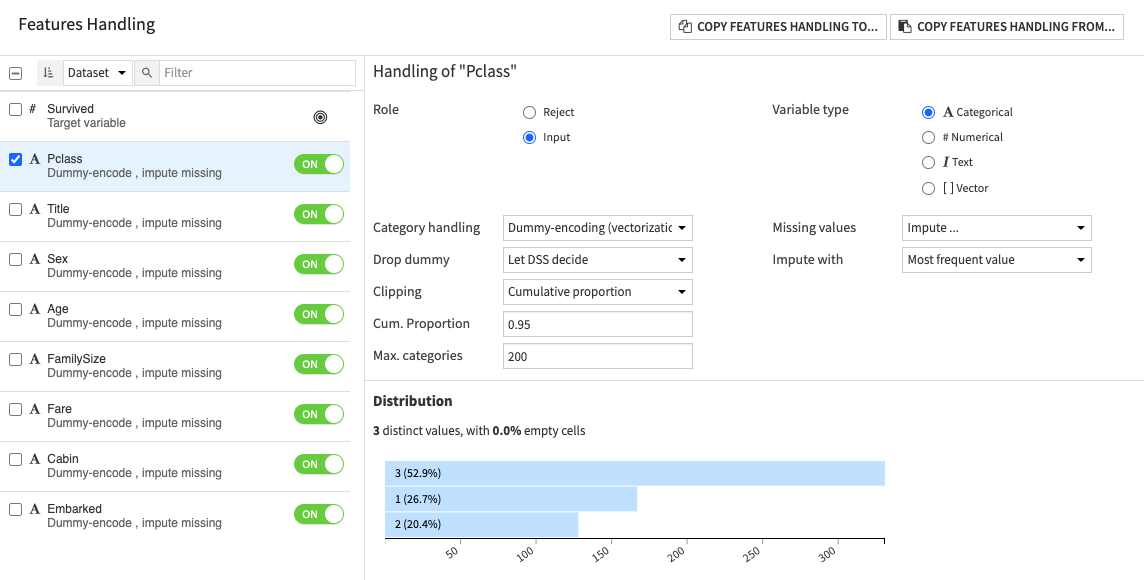 Many of the features of the dataset, have been modified through One Hot Encoding method, that way the ML algorithm would understand them and decipher them better by changing them to categorical units.
Initial Dataset Features
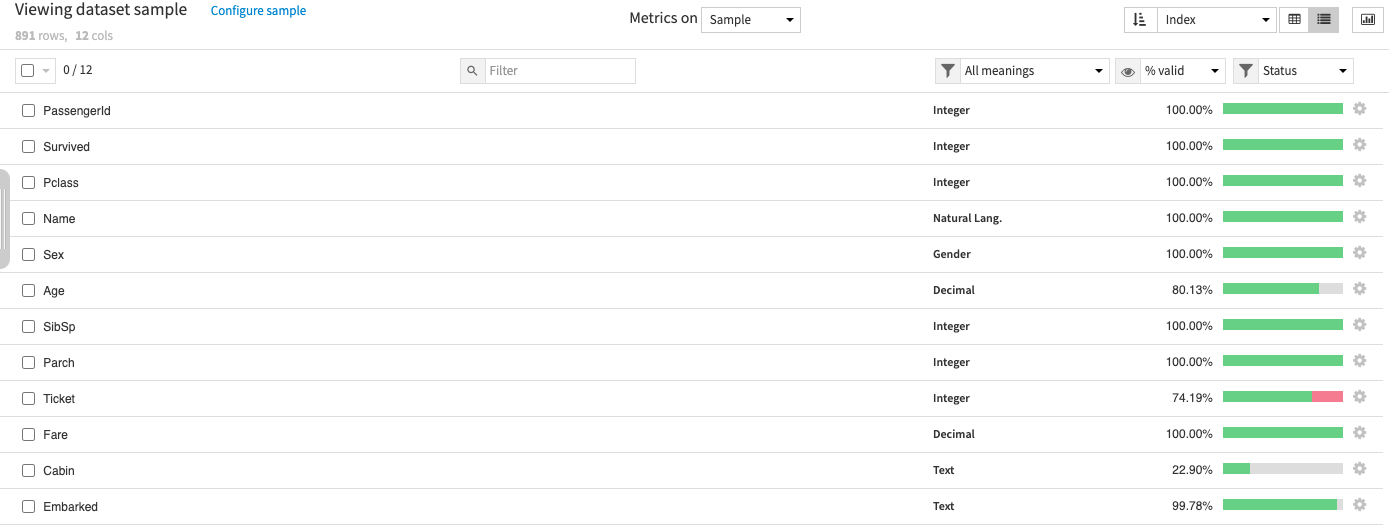
Data Dictionary
Survived: 0 = No, 1 = Yespclass: Ticket class 1 = 1st, 2 = 2nd, 3 = 3rdsibsp: # of siblings / spouses aboard the Titanicparch: # of parents / children aboard the Titanicticket: Ticket numbercabin: Cabin numberembarked: Port of Embarkation C = Cherbourg, Q = Queenstown, S = Southampton
By default, the initial dataset coming from Kaggle’s challenge page would give you the above dataset features at hand. But we’ll try to optimize them to something much more Machine Learning friendly looking dataset. And this is how I did it.
Name Column
This is something you would normally do in Python to extract the Name information from the dataset. The objective is to get the Title information, so that you may utilize them into something more categorical, so that the Machine Learning algorithm could understand them better.
train_test_data = [train, test] # combining train and test dataset
for dataset in train_test_data:
    dataset['Title'] = dataset['Name'].str.extract( '([A-Za-z]+)\.', expand=False)
Here’s the similar method in Dataiku, in a way they produce the similar output, through their Data manipulation recipes canvas.
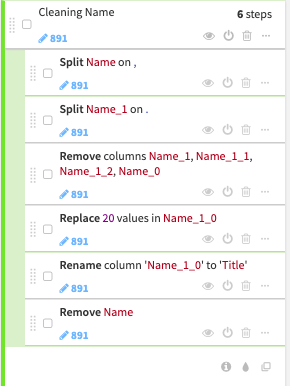
Name Remapping
Now let’s map a categorical number to depict those Title values.
- Mr : 0
- Miss : 1
- Mrs: 2
- Others: 3
You could do the similar in python with these following codes:
title_mapping = {"Mr": 0, "Miss": 1, "Mrs": 2,
                 "Master": 3, "Dr": 3, "Rev": 3, "Col": 3, "Major": 3, "Mlle": 3,"Countess": 3,
                 "Ms": 3, "Lady": 3, "Jonkheer": 3, "Don": 3, "Dona" : 3, "Mme": 3,"Capt": 3,"Sir": 3 }
for dataset in train_test_data:
    dataset['Title'] = dataset['Title'].map(title_mapping)
Whereas in the case of Dataiku, it’d be something to this degree.

Sex Column
Now let’s move on to the next data column, the sex column. It’s pretty common that just about any Gender data values would give you ‘Male’ or ‘Female’ attributions. But categorical requirement, would still be needing you to change that to numerical attribution. In python, you could this to have the output:
sex_mapping = {"male": 0, "female": 1}
for dataset in train_test_data:
dataset['Sex'] = dataset['Sex'].map(sex_mapping) Whereas in the prepare recipes, you might do something like this to achieve the similar output. <br /><br /> 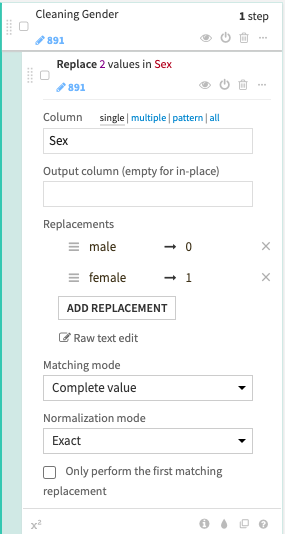
Jupyter Notebooks
- Jupyter Notebooks
- Correlations analysis on Titanic Data with Dataiku
- Statistics and tests on multiple populations with Dataiku
- Time-Series analytics on Titanic with Dataiku
Disclaimer
And please remember, as this is only a weekend pet project, which I’m doing them for my personal interest only.